Sunday, August 28, 2011

The pain of News Corp


Of course, the worst month(s) come as soon as I have scaled up the capital haha.


Oh the joys of trading !


(August doesn't look crash hot either)

Sunday, July 3, 2011

Time to scale up


June was disappointing, with a result of -2.17%, bringing our first monthly loss since January.


So overall for the half year we are +34.23%.


Starting from next month, I will be scaling up the system, so from July 1st, starting capital will be US$60,000. I'll probably start the trade log and %chart again, but the monthly profit chart will be able to show percentage performance regardless of the capital base.


I have also made a change to the position sizing of the system, to make the system more aggressive. We are now allocating more capital to each trade, 25% instead of 20%, which means we are maxed out at 4 positions.

Thursday, June 2, 2011

May performance


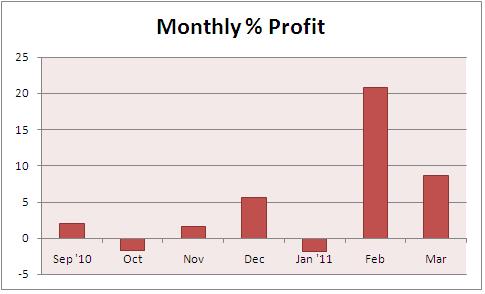
Quiet month in terms of number of trades, but we hit our numbers. +4.53% for May which brings us to +36.40% YTD.


I've also been busy designing a new system, called TPO, another US stocks, mean-reversion based automated system, which is currently being papertraded. I couldn't trust any of my backtests with this one as it really does require intraday data to be accurately tested. So we'll run it for 6-12 months on IB's papertrader and see how the numbers stack up.

Sunday, May 1, 2011

April performance


April was a steady month, without being spectactular, with a result of +4.30%.


There were 20 trading days in April (US markets were only closed on Good Friday), the system had some activity on 8 of those days. From these 8, only on one occasion were we fully invested.

Friday, April 1, 2011

Six months in


+8.53% for March and +27.57% for the first quarter. We've hit the 6 month mark so I've added a few more charts.

While results have been promising, I would expect the payoff ratio to even out over time and the hit rate to edge closer to 70 than 60%.

On March 15th, IB's margin risk controls didn't seem to kick in so I found myself holding 21 positions, well beyond my maximum of 5 or 6. So I just closed all positions (out of panic) 3mins into the session and ended up +$1499 for that day.

Monte carlo analysis shows that performance for March 15th, had the number of positions been restricted as per the system, could have been anywhere between -$200 and +$2258 depending on which stocks I bought, with the median being $799.

So while the broker error didn't leave me much to complain about(!), it did show that automated trading systems still need monitoring. Especially if your system buys weaknesss and you can see the futures are down 2% in the pre-open!

Friday, March 25, 2011

Correlation between volatility and performance


As a system (AGT is what I call my system) that trades intraday, its no surprise that it performs well in times of volatility where the intraday range expands, which is what typically happens during bearish times.


So it has got a bit of an insurance mechanism built-in to protect from Black Swans. But unlike the techniques employed by funds like Universa, AGT is not too shabby during uptrends either.


The peak of the GFC, which is from September 15th 2008 (Lehman Brothers collapse) until March 9th 2009 which was the bottom, when the VIX went crazy, is also the time AGT went nuts, and tacked on 83% in under 6 months.


Tuesday, March 1, 2011

Saturday, February 12, 2011

Tuesday, February 1, 2011

Wednesday, December 1, 2010

RYAAY and performance thus far


I have noticed that this system trades RYAAY a fair bit more and disproportionately compared to the percentage of the stock universe this ticker represents (I trade about 50 stocks).


Looking at the chart, it's not hard to see why. RYAAY does like to gap around.


Overall, while the performance so far for the last two and half months is unlikely to lead to an onrush of investors wanting me to trade their money, the system has so far been performing in line with expectations.


This system, by design, thrives on intraday volatility. The more volatility there is, the better it performs. As we all know, intraday volatility is the highest in bearish times. In makes much more moderate profits in times where the market is slowly going up.


To illustrate this, let's look at 2009 performance.

From 1st March to 31st December the general market rose almost 50%.

My system in that time "only" returned 27%.


However, in January and February, where the market fell about 10% per month, the system made 30%+ in each of those months.


Note that I only include the market performance for the purposes of comparison. It is not a benchmark we are trying to beat. To make -5% when the market is -20% is not a good year for me. I aim for absolute returns.

Saturday, October 2, 2010

And we're off! Finally!


Finally got this system trading on a live account! After more than a year of testing, coding, and paper trading.

I'm still amazed at seeing the trades execute by themselves and though I don't need to, some nights I just sit and watch the system to do its thing.

For interests sake - had I started at the beginning of the month, I would have done 14 trades and end of month result would be +$2,472, or 9.62%.

Saturday, May 22, 2010

US mean reversion system


I haven't been able to paper trade this new system of mine as initially attended because LOO and MOC order types simply don't work on IB's paper trader.


The guy at IB told me that I "can't expect" the paper trader to be able to execute such specific order types - but he would fully expect that I would have no problems with a live account.


So instead of paper trading this system I will start live trading with a small account until I'm happy that performance is broadly in line with expectations before scaling up.


The above table shows performance of the system so far this year, from 1 Jan through to 21 May. Monte carlo simulations were run 1000 times.

Friday, March 19, 2010

Re-defining equity

Since the last update, five trades have been closed out. Three losses and two winners. Overall slight dip in closed equity since that October chart.

Portfolio is currently fully invested in the market.

I've also decided to use another method to determine my position sizing. I previously was using the TradeSim method which is available cash + open positions at the price paid. While the intention of this method is to be conservative (not count chickens before they hatch) in practice I have found it to be rather aggressive and to take on more risk than necessary as you are increasing your size in what could be the beginning of a drawdown.

Big winning trades are usually closed out when the market is correcting or experiencing a downturn of some sort, which is precisely when you DO NOT want to be increasing your position size.

The other obvious alternative to this is to use pure open equity marked-to-market, which I think is too aggressive and will result in too many fluctuations. Plus I don't really count open equity as my own.

So what I have opted for is what I consider to be a middle ground and to calculate my total equity as available cash + open positions at their trailing or initial stop loss levels (whichever is the greater). I think this method is conservative initially but as your winners start moving and stops are raised, it allows you increase your position sizes more dynamically.

The downside is I have not been able to test this method. But common sense tells me that it won't get me into too much trouble.

I have also been reading some of Ralph Vince's work, and I have been impressed. There are some areas which I have marked down for re-visiting down the track once I have time.

In other news, I've been busy trying to automate my US mean reversion system through Amibroker and IB.

Saturday, October 24, 2009

Quarterly Portolio Update

There were no trades closed this quarter. The system is fully invested in the market and has been for several months now.

Just thought I'd put in an equity curve - probably not the best you've seen!

Start up date was the 9th October 2007 with $66,000 in capital.
Since then 51 trades have been closed.

We are still in the middle of a drawdown - max.DD stands at 40.56%.

Thursday, October 22, 2009

System flaw

The gap fading system that I was hoping to trade on US stocks has run into a bit of trouble. Actually alot of trouble. The problem is that it can't be traded, and here's why.

I believe the opening auction system works differently in the US compared to the ASX. In the local market, the most liquidity for the large cap stocks especially, always occurs at the open and at the close (usually higher at the close).

BHP or CBA, for example, each of which routinely turnover hundreds of millions of dollars per day , would do about $2-10million right on the open.

But over in the US, even some of the high turnover NYSE tickers like WYE and JNJ, you only get 100 shares going through on the open! And these guys turnover the same or more than BHP or CBA. What i noticed in the course of sales is, about 5-10 seconds after the open, the party finally gets started and you see the 10,000 share and 20,000 share parcels start going through. Which is useless for a system that is supposed to buy "the open" as you wouldn't be able to catch this liquidity using "limit-on-open" type orders.

The NASDAQ opening auction system must work differently to the NYSE because they seem to have much higher opening liquidity across the board (in the hundreds of thousands range, so still not the millions I was hoping for).

So its back to the drawing board for the short term system. It looks like I may need to turn to intraday timeframes if I want to maintain my 100% overnight cash position and still generate a super smooth equity curve.

Saturday, October 3, 2009

The leveraged model


Considering the maxDD stats were acceptable, even during the 2008 Black Swan, the system will be leveraged up. Here are the charts of CAR and maximum drawdown over a 10-year test (01-01-1999 until 31-12-2008), using 30% margin as per I.B.


Wednesday, September 30, 2009

The beauty of trading short term


You just can't beat that super smooth equity curve.

This system uses a different entry to the one in the system posted below (US stocks) but was tested over the same universe of stocks.

Seems to have more of an edge. High Pfactor, lower maxDD, higher win%, higher payoff, less trades. And did I mention the equity curve?

The performance report shows the system in its inherent form, to provide a fair comparison with the system below. The equity curve and monthly profit chart show the system traded on 30% margin, which is what it would be traded on, if it gets to that stage.

Tuesday, September 22, 2009

US Stocks


I've recently been looking at US stocks and the potential to trade short term systems there is amazing due to the wide range of stocks and their liquidity.

The system that I've come up with is similar to the system described here a few months ago that traded ASX stocks through CFDs. Both systems are based on mean reversion and never hold overnight. But while the ASX system shorted overbought stocks and bought oversold stocks, with several days lookback and magnitude moves considered in the entry criteria, this US system just fades opening gaps and trades long only.

I have found gap fading (particularly going long gap downs) to be a robust edge that has worked well over many different universes of stocks. The idea came from James Altucher's book and also from this trader describing fading extremes as one of his favourite setups.

There are no CFDs in the US but my broker does allow 4:1 leverage intraday if required. The universe of stocks consists of 50 tickers from either the Nasdaq 100 or S&P 100, so I'm looking for liquidity and scalability in the system.

The system makes about 30-100 trades a month and performance is consistent with profitability on average 10 months of the year. 2008 was a tough year, but out of 10,000 portfolios, monte carlo testing shows that 98.59% were profitable last year, with the median portfolio gaining about 10%.

So the previous STMR system will not be traded; and this new one will take its place. I intend to use IB's PaperTrader to simulate it for about a year before committing real dollars to it.

Performance stats below are from 01-01-2003 until 31-12-2008. Position sizing is 10% of equity. Commissions are included (however, slippage, is not accounted for).

Sunday, July 26, 2009

FY2009 Performance


"Don't love open equity. It won't love you back"

The above quote is what a great trader once said to me. Watching open equity get whittled away is something that nobody tells you about when you design long term trend following systems. All you tend to focus on is the bottom lines of profit and maximum drawdown. But the journey to get to that destination is what we all must go through. And that journey can be much harder than you expect.

I was looking at where the system was at the end of FY2008 and PRC I saw was up 82% and the pyramid up about 37%. When they were closed, profit was just 38% and 10% respectively.

You will notice all of a sudden I'm only down just 10% for the year - how come? It's because I've decided to try and focus less on open equity and more on closed equity. Sure I won't have those weeks when i "make" $2,000+ but I won't be "losing" that amount either. For interest's sake, the system was down 21.00% for the year on an open equity basis.

So from now on, no more reports on open equity, and I will only be reporting closed equity on this blog. And since I only close trades every few months, even monthly blogging will not be needed. Perhaps quarterly.

My other system (short-term mean reversion) will be started up on a small scale sometime in the next few weeks/months and its progress will be monitored here.

Thanks to those who have followed and commented on this blog for the past 12 months. Good luck for FY2010.