

Since the system has been designed to trade only the most liquid ASX20 stocks, that's only about 10 symbols. And thus it can be argued that 175 trades over 10 years over only a few tickers is not enough to indicate whether or the results are statistically significant or whether or not the system has an edge.
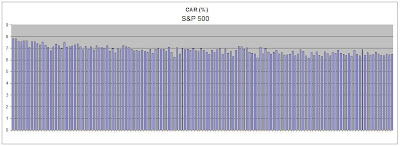
So what I've done here is test the system "as-is" over a broader market, the ASX100. And then I also tested it on the S&P500 stocks and the NASDAQ 100. Note that the 10 year return for the S&P500 is actually negative.
Monte carlo analysis wasn't done on the NASDAQ as there was only the one possible pathway of trades. I know this because I was about a quarter way through the test when I noticed that every single value for each column was the same in each run.
The system is not intended to trade US markets (at least not at this stage) as CFDs are not available there.
Interestingly, 2008 was a great year for the system both locally and overseas. On the ASX100 +2.9%, on my culled universe +6.9%, on the NASDAQ100 +6.4% and on the S&P500 +23%.
No comments:
Post a Comment